
Smarter Insights, Faster Decisions: Enhanced Analytics in Business Central 28.x
In Dynamics 365 Business Central 28.x (2026 Release Wave 1), Microsoft continues to bring analytics to where users already work. Rather than relying on static reports or waiting for data to be exported, this release delivers richer, role‑specific insights directly inside Business Central—helping users analyze trends, spot issues, and take action without breaking their flow.
The updated Financial, Sales, and Inventory Analytics experiences showcase how Business Central analytics are evolving from “something you look at later” into an integral part of daily decision‑making.
Across all functional areas, the analytics improvements in BC 28.x share three common goals:
- Contextual insights – Analytics are embedded in the pages users already know
- Self‑service exploration – Users can interact, filter, and pivot data without IT or custom reports
- Actionable clarity – Visuals and KPIs focus on decisions, not just numbers
The result is an experience that feels less like reporting and more like guided analysis—designed for business users, not data specialists.
Financial Analytics
Business Central 2026 Wave 1 enhances Financial Analytics with practical improvements that help finance teams review results faster, reduce manual effort, and gain clearer insight during and beyond period close.
What’s Improved for Users
- Improved Excel Deferral Reports
Built‑in Excel layouts for deferral reports (Deferral Summary – G/L, Purchase and Sales) now include out‑of‑the‑box subtotals, making reports easier to review, validate, and share without manual formatting. - Faster Finance Excel Reports
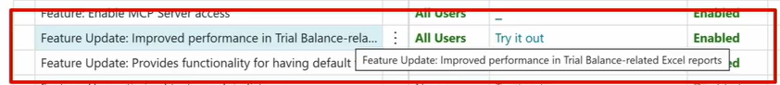
Performance‑optimized finance reports—especially trial balance reports (Trial Balance, Consolidated Trial Balance, Trial Balance/Budget, Trial Balance by Period and Trial Balance Previous Year)—run significantly faster, supporting quicker analysis and a more efficient close. (This feature requires enablement under Feature Management.)
Instead of waiting until month‑end or relying solely on static spreadsheets, finance users can investigate questions like:
- Why did expenses spike this month?
- Which accounts are driving changes in margin or cash flow?
- How is actual performance tracking against budget right now?
The experience is designed to support continuous financial awareness—enabling finance teams to identify trends, investigate variances, and take action earlier, while still supporting traditional reporting and close processes.
Sales Analytics
Business Central 2026 Wave 1 enhances Sales Analytics with new insights that help organizations understand customer behavior, improve retention, and make better sales decisions using built‑in analytics across Power BI, Excel, and product analysis.
This release focuses on making sales data easier to analyze and act on, with improved reporting, better visibility into customer loyalty, and richer demo data to support storytelling and evaluation.
What’s Improved for Users
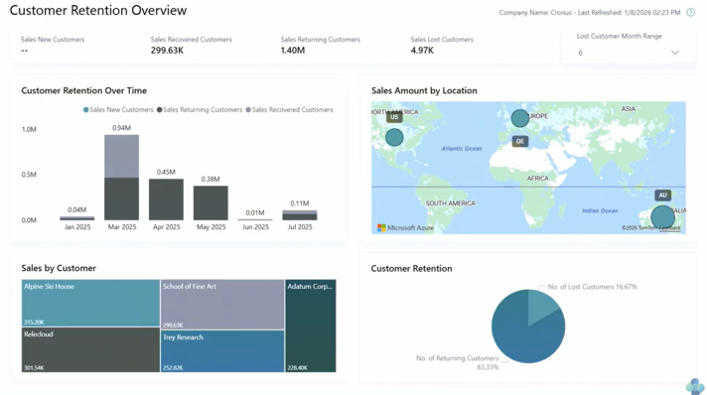
- Customer Retention and Churn Insights (Power BI)
New Customer Retention Overview and History reports in the Sales Power BI app provide visibility into recurring, returning, and churned customers. Users can analyze retention trends by customer or geography and identify early signals of customer loss.
Benefit: Better insight into customer loyalty and opportunities to reduce churn.
- Enhanced Built‑in Sales Reports (Excel)
Previously released sales reports with Excel layouts now include out‑of‑the‑box subtotals, making them easier to analyze and present without manual PivotTable updates. These reports include Salesperson Commission, Customer/Item Sales, Inventory Order Details, Inventory Customer Sales and Inventory – Sales Back Orders.
Benefit: clearer sales reporting with less manual effort.
- Analysis Tabs for Sales Pages (Coming soon!)
New Analysis views are being added to sales list pages, such as Expected Sales Volume, Customer Sales by Volume and Aged Accounts by Month.
Benefit: Faster insight directly in the application, with less dependence on external tools. (These views are delivered in version 28.x and will appear shortly after the initial Wave 1 release.)
Instead of relying solely on historical reports, sales teams and leaders can now answer questions like:
- Are we retaining our customers—or losing them?
- Which customers are recurring, returning, or churning?
- Where are sales trends changing by region or customer group?
Sales Analytics in Business Central supports ongoing visibility into sales performance, helping teams strengthen customer relationships, focus on the right opportunities, and make data‑driven decisions faster.
Inventory Analytics
Business Central 2026 Wave 1 enhances Inventory Analytics with modern, built‑in insights that help organizations reduce supply chain risk, focus on high‑impact items, and make inventory decisions with greater confidence.
This release completes the modernization of inventory analytics, bringing legacy reports into Power BI, Excel, and in‑product analysis, making inventory data easier to access, easier to analyze, and easier to act on.
What’s Improved for Users
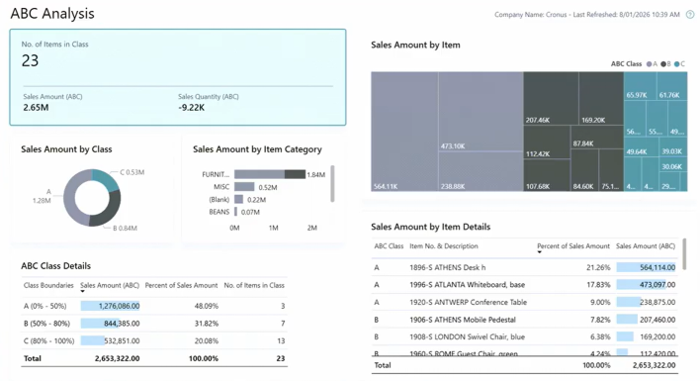
- ABC Analysis for Inventory Optimization
New ABC Analysis is available across Power BI and Excel, helping organizations classify inventory items into A, B, and C categories based on sales contribution. This highlights which items should always be on hand versus those that can tolerate lower stock levels.
ABC thresholds are configured once and consistently applied across reports, supporting more focused supply chain and stocking decisions.
Benefit: Prioritize the items that matter most and reduce risk for top‑selling products.
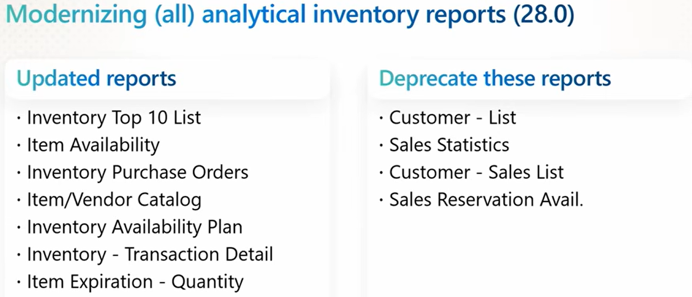
- Modernized Inventory Reports (Excel and Word)
Legacy inventory reports have been modernized with Excel and Word layouts, making them easier to customize, analyze, and present. New reports include:
- ABC Analysis (Excel)
- Item Age Composition by Quantity and Value (combined analysis in a single view)
Additional existing inventory reports now include Excel layouts for ad‑hoc analysis, improving consistency and usability across inventory reporting.
Benefit: flexible, self‑service reporting using familiar tools.
- Improved Readability with Subtotals (Coming soon!)
Based on user feedback, subtotals are being added to new inventory Excel reports to improve readability and analysis within Excel worksheets. These reports include Inventory Transaction Detail, Vendor Purchases, Order Details, Customer Sales and Sales Back Orders (Subtotals are arriving shortly after the initial Wave 1 release, starting in version 28.x updates.)
Benefit: Clearer inventory reports with less manual effort.
- Analysis Tabs Added to Inventory Pages (Coming soon!)
New pre‑built Analysis views will be added to inventory pages such as Item Ledger Entries for Inventory on Hand, Inventory throughput, Inventory movements and Returned items by return reason.
These views can be personalized or hidden as needed.
Benefit: Faster insight directly into the application, no exports required.
Instead of relying on static or legacy reports, inventory teams can continuously answer questions like:
- Which items represent the greatest supply chain risk?
- Are we overstocked or understocked on key products?
- How old is our inventory—and where is value tied up?
Inventory Analytics in Business Central supports proactive inventory management, helping organizations reduce risk, improve availability, and make smarter inventory decisions using consistent, modern analytics tools.
Summary
With the 2026 Release Wave 1, Microsoft reinforces that analytics in Business Central are no longer an add‑on—they are a core part of the user experience. Financial, Sales, and Inventory Analytics now work together to provide a clearer, more connected view of business performance.
The result is not just better reporting, but a smarter ERP experience—one that helps organizations move from knowing what happened to understanding what to do next.
Contact us for more information, or if you need assistance navigating your Dynamics BC solution.