PTC Analytics
PTC Analytics is a set of pre-built interactive Power BI dashboards that improve visibility into critical business data from Dynamics GP so you make faster, more informed decisions for your organization.
Get rid of your time-consuming Excel Spreadsheets and Smart Lists and embrace the power of Power BI data analysis instead. With Power BI’s powerful visualization tools, you’ll be more effective in your decision-making.
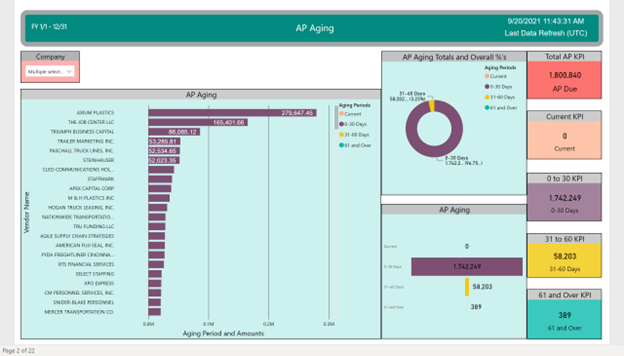
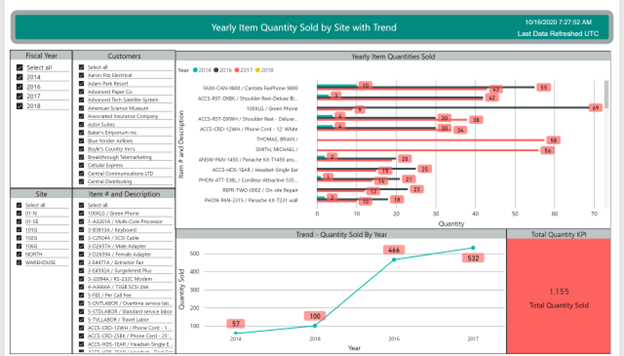
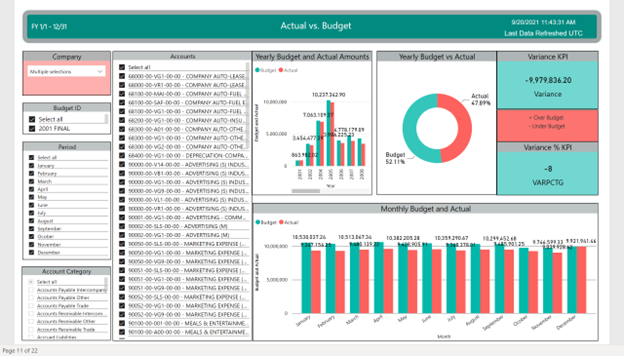
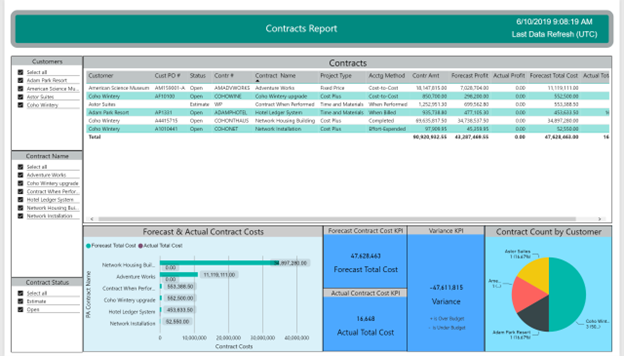
This unique reporting tool combines your existing GP data with the analytics strength of Microsoft Power BI, Microsoft’s flagship, Data Analytics, and AI Reporting platform. Go beyond raw numbers with more than 100 expert-built insightful reports and dashboards that deliver an in-depth glimpse inside your business, exploring your Dynamics GP data has never been easier. Analyze and visualize your data from Microsoft Dynamics GP anywhere, on any device. See charts, graphs, and projections of your company’s future financial standings at a glance.
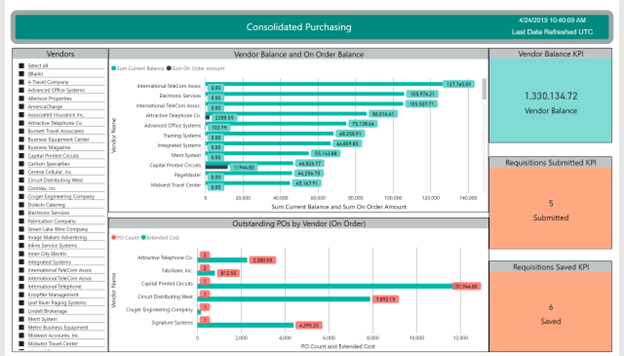
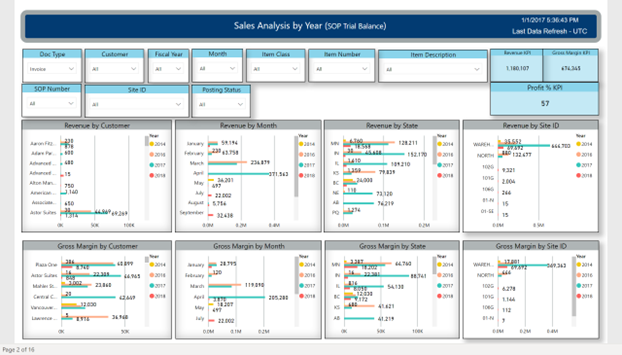
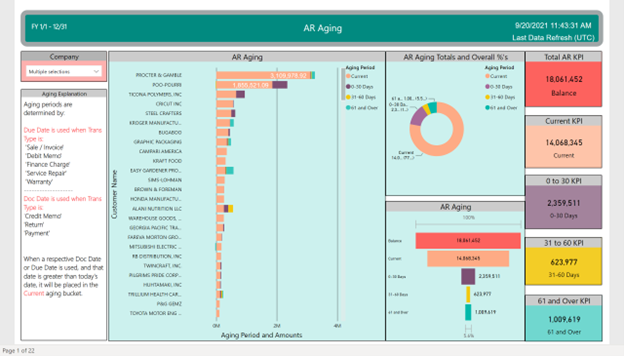
Our PTC Analytics suite of 100+ pre-built, interactive, and scalable dashboard reports will analyze all of your GP data including GL, AR, AP, Trial Balance, Sales Analysis, Profitability, Forecasting, Budgets, Bank Reconciliation, Inventory, Purchasing, Project Accounting, and provide valuable data analytics, insightful and stunning graphic data representations, enabling you to make quicker and more informed, data-driven, decisions for your organization. This level of Data Analytics and AI is far beyond the capability of any paginating reporting solution available today
6 Reporting Packs Available
- Financials
- Purchasing POP
- Sales and Revenue Analysis RM & SOP
- Project Accounting
- Inventory
- Manufacturing (coming soon)
Get More Information
Fill out the form below to schedule a free Microsoft Dynamics GP consultation:
Works on all GP versions
Still using the same GP software you used a decade ago? The Power BI report pack doesn’t care. No matter what GP version you’re using, all Report Pack users get the same insightful experience. All without IT involvement, data mapping or a data warehouse.
Delivers state-of-the-art features
Why limit yourself to static spreadsheets? They’re difficult to update and cumbersome. Plus, no matter the cost, there’s not a single Excel-based reporting system which matches the AI, data analysis and question-and-answer capabilities of Power BI.
Uncovers key insights
No time to comb through your data looking for any important changes? Let the Power BI report pack do the work for you! With just a click of the mouse, its powerful algorithms go to work finding all outliers, seasonality shifts, key correlations and more.
Gets everyone on the same page
Publish dashboards once and share them with your entire team or company. Have some sensitive data? Want to avoid information overload? No problem! Give users access only to the information that matters to them.
Speaks your language
Need quick answers to common business questions like, where are my sales strongest, where am I losing money or which accounts are past due? Just type in your question and Power BI Report Pack for Dynamics GP instantly creates the visualization you need.
Service you can count on.
Experience you can depend on.
Expertise you can trust.
